Two years ago Phil Haack created a tool called SeeGit. The tool visualizes the history of a GIT repository.
I decided to create a similar tool which uses yUML diagrams to render the history graph.
My tool has the ability to merge linear commits into a single node, which makes it easier to get a quick overview of a large history.
Creating the graph
To get the all history elements of a GIT repository the library LibGit2Sharp is used. After retrieving all commits of all branches, linear commits are merged into a single element.
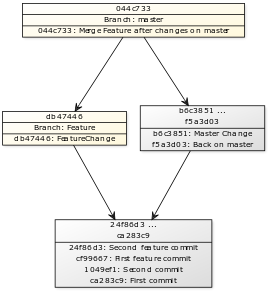
Commits are merged if they don't have several parents (merge commit) or more than one child (new branch is created). This results in a graph where all linear commits are merged and you are able to see only the branch structure of your repository.
The resulting yUML diagrams
Rendering the graphs with yUML.me is pretty easy.
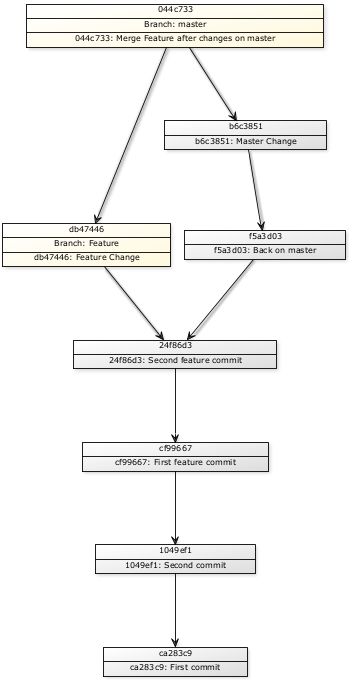
The following picture shows the full graph of a GIT repository:

This picture shows the corresponding merged graph:

Source Code
The latest source code can be found on GitHub.
